

Quick answer
You can run a budget on five core categories: housing, transportation, food, savings & debt, and personal spending. Other expenses can sit under these as subcategories. For a reality check, the average U.S. household spent $6,545 a month in 2024, with housing alone taking 33.4% of that spending. With consumer prices up 3.4% in the 12 months through August 2026 (BLS Consumer Price Index), it’s worth matching your categories to real numbers.
Here’s how a lot of budgets die. You sit down on a Sunday, find a giant list of “budget categories you NEED,” spend the afternoon building the perfect spreadsheet with a line for “pet grooming” (you don’t have a pet), and then… stop opening it. By February it’s a guilt tab.
The problem probably wasn’t you. It was the giant list. Each extra category is one more decision you have to make when you buy something, and a budget is supposed to remove decisions. Meanwhile the money keeps leaking, and with consumer prices up 3.4% in the 12 months through August 2026, a leak tends to cost more than it did a year ago.
So let’s do this the sane way: five categories, real benchmarks from actual government spending data, and a simple setup.
Key takeaways
- Five core budget categories give day-to-day spending a home. Subcategories are optional detail, not homework.
- Housing and transportation took about half of the average U.S. household’s spending in 2024 (50.4%, per the BLS Consumer Expenditure Survey). Benchmark yourself against that before judging your latte.
- More categories doesn’t mean more control. It can mean quitting by February.
- A template that totals your categories for you takes the math off your plate.
Start with five categories, not a giant list
Budget categories are just the buckets you sort your spending into so you can see where your money actually goes. That’s it. And a good bucket system uses the fewest buckets you can get away with.
Why five? Because a budget is much easier to use when you can hold the whole thing in your head. Five numbers, you can. You know roughly what’s left in your food bucket the way you know roughly how charged your phone is, no spreadsheet required in the checkout line. A page full of numbers, forget it. That’s a lot to juggle on a Tuesday.
Here are the five buckets:
1. Housing: rent or mortgage, utilities, internet, renters/home insurance, repairs. The big one.
2. Transportation: car payment, gas, insurance, maintenance, parking, transit passes, the occasional rideshare you pretend didn’t happen. When the car itself is the goal rather than the line item, how to save for a car works through the down payment math.
3. Food: groceries and eating out. Keep them as two subcategories under one roof; splitting “coffee” from “restaurants” from “snacks” is how spreadsheets go to die.
4. Savings & debt: your emergency fund, retirement contributions, extra debt payments, and any sinking fund for non-monthly stuff like car repairs or holiday gifts. This is the category that builds Future You’s cushion, so it gets paid like a bill.
5. Personal: fun and human stuff like subscriptions, clothes, gym, haircuts, hobbies, gifts, the guilt-free stuff. One bucket, one number, spend it however you want. If one hobby quietly eats that whole bucket, measure it before you cut it. A session tracker that reports cost per hour can settle that argument faster than willpower does.
If you love detail, add subcategories under each, but the five top-level numbers are what you actually check each week. That’s the trick: you can have detail without having to manage detail. (This is also how the free monthly budget template works: you type your categories into its budget-vs-actual section, and the totals calculate themselves.)
What real households actually spend on each category
Before you assign numbers, it helps to know what normal looks like. Not influencer normal. Measured normal. The Bureau of Labor Statistics tracks what American households actually spend, and in 2024 the average came to $78,535 for the year, or $6,545 a month.
Here’s how that breaks down:
| Category | Share of spending | Avg. per month |
|---|---|---|
| Housing | 33.4% | $2,189 |
| Transportation | 17.0% | $1,110 |
| Food | 12.9% | $847 |
| Insurance & retirement | 12.5% | $816 |
| Healthcare | 7.9% | $516 |
| Entertainment | 4.6% | $301 |
| Other spending | ~11.7% | ~$766 |
Two things jump out. First: housing plus transportation is 50.4% of total spending, so about half of the average household’s spending is committed before food even enters the picture. Second: entertainment, the category budgets love to punish, is under 5%. If your budget feels broken, the bigger lever is often the big two, not canceling a streaming service.
Use these as a mirror, not a report card. If your housing share is well above the average because you live in a big city, that’s context, not failure. It just means other categories have to flex smaller.
How to set up your budget categories
Step 1: Pull your last month of spending. Bank app, statement, whatever. Don’t judge it yet. Just look.
Step 2: Sort each transaction into the five buckets. Be fast and sloppy: “close enough” is the goal. That weird online order? Personal. Done.
Step 3: Total each bucket and compare to the BLS table above. This is the “oh.” moment. You may spot a category that’s further off than you expected.
Step 4: Set next month’s number for each bucket. Start with what you actually spent, then trim the one category that’s furthest off. Don’t try to fix the whole budget at once; that’s a crash diet.
Step 5: Check in once a week. Five numbers. That’s the whole habit. If you’re paid biweekly, the budget by paycheck template converts that pay into a monthly figure, so your five buckets still have a monthly income to work from.
Let the spreadsheet do the totals
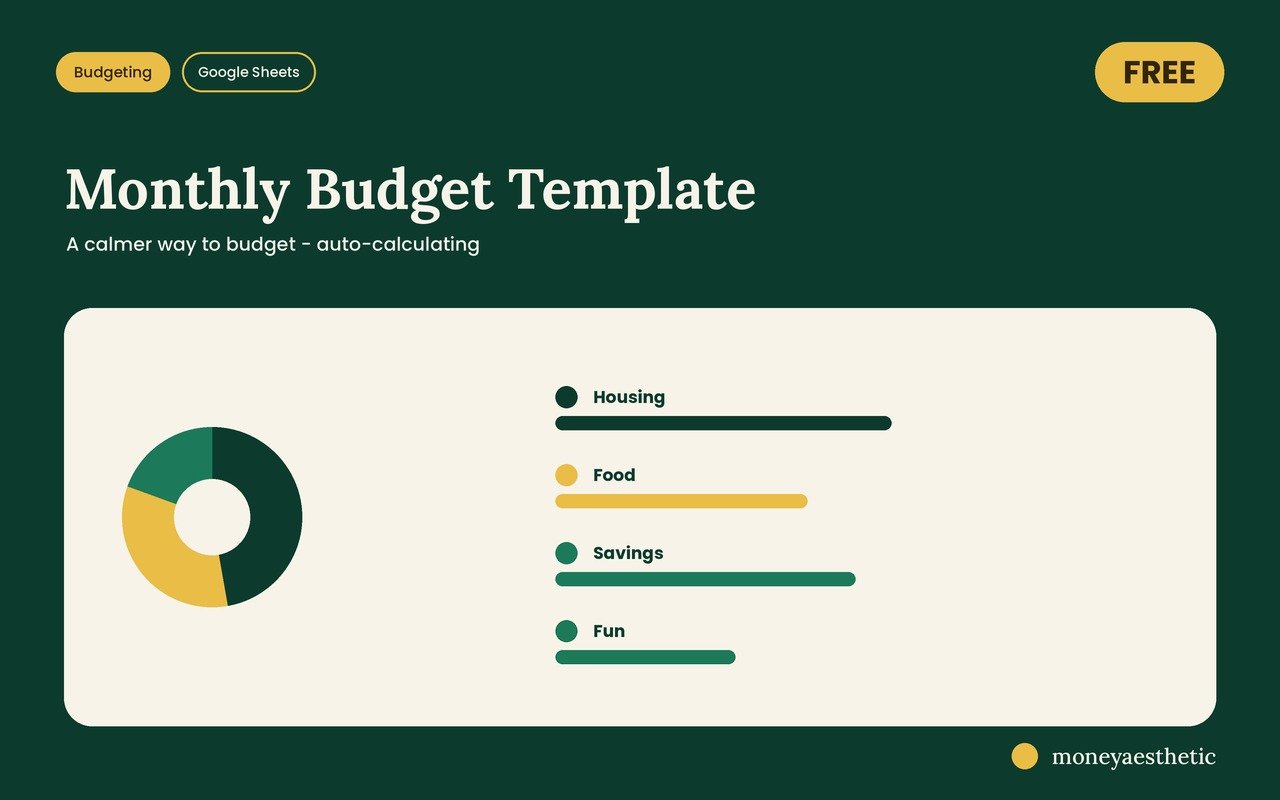
The free Monthly Budget Template is a Google Sheet with a budget-vs-actual section. Type in your categories and numbers, and the totals, differences, and over/under snapshot calculate automatically. No formulas to write.
Get the free template →Common misconceptions about budget categories
“More categories = more control.” Backwards. More categories means more sorting decisions, more edge cases, and more chances to quit. In practice, control tends to come from checking five numbers weekly, not from tracking “household consumables” separately from “cleaning supplies.”
“There’s an official correct percentage for each category.” There isn’t. The 50/30/20 rule and the BLS averages are starting points, not laws. Your rent in a big city and your cousin’s rent in a small town should not be judged by the same percentage.
“Savings is what’s left over at the end.” An expensive myth. If savings isn’t a category with its own number paid at the start of the month, it tends to lose to the rest of the month’s spending.
“I need to categorize each transaction perfectly.” Nope. If you can’t place a transaction quickly, put it in Personal and move on. A roughly accurate budget you actually use beats a perfect one you abandoned.
The annual category check a lot of people skip
Here’s the part a lot of category lists skip: your percentages have an expiration date. Consumer prices rose 3.4% in the 12 months through August 2026, and not evenly. Energy swung hard, shelter kept climbing, groceries crept up. A category number you set a while ago can be quietly off today, and “quietly off” is how budgets fail while looking fine.
So once a year (pick your birthday month, it’s easier to remember), rerun Step 3. Pull a month of spending, re-total your five buckets, and compare against your targets. If a category drifted, that’s not a moral event; rent went up, gas did whatever gas does. Adjust the number and keep going. Think of it as a small yearly tune-up, and honestly, it’s a lot easier to stick with when the spreadsheet does the totaling for you. If you want the deeper version of giving each dollar a job, zero-based budgeting is the natural next step. If you keep a yearly budget planner, that check-in fits right on it.
FAQ: budget categories
What are the main budget categories?
A simple set of main budget categories is housing, transportation, food, savings & debt, and personal spending. You can sort household expenses into these five buckets and add subcategories under each if you want more detail.
How many budget categories should I have?
Five core categories is a good starting point, with optional subcategories if you want more detail. Fewer categories means fewer sorting decisions at each weekly check-in.
What percentage of income should go to each budget category?
It depends on your income and costs. For comparison, in 2024 the average U.S. household spent 33.4% of its total spending on housing, 17% on transportation, and 12.9% on food, per the BLS Consumer Expenditure Survey. Use these as benchmarks, not rules; your city and season of life change what’s realistic.
What is the 50/30/20 rule for budget categories?
The 50/30/20 rule sorts after-tax income into three categories: 50% needs, 30% wants, and 20% savings and debt payoff. It’s a simpler alternative to detailed categories and a good starting point for beginners.
What are fixed and variable expense categories?
Fixed expenses stay the same each month, like rent, insurance, and subscriptions. Variable expenses change month to month, like groceries, gas, and entertainment. Many categories contain both types. Gas is a variable cost you can influence, and how to save money on gas covers the levers that actually change it.
What category do subscriptions go in?
Put subscriptions in your personal spending category unless they’re essential to work or home, like internet. Grouping them there keeps the fun-money bucket honest, since streaming and apps are wants, not bills.
How do I budget for irregular expenses like car repairs or gifts?
Use a sinking fund: divide the yearly cost by 12 and save that amount monthly inside your savings category. For example, $600 a year for car repairs works out to $50 a month instead of a surprise bill.
Should savings be its own budget category?
Yes. Savings should be a category with a fixed number paid at the start of the month, not whatever is left over. Treating savings like a bill means it gets paid before the month’s other spending.
This article is for general education, not personalized financial advice. Figures cited are from the BLS Consumer Expenditure Survey (2024) and the August 2026 Consumer Price Index. Your situation is unique, so consider talking to a qualified financial professional for decisions that affect it.